A Tiny Gift for Spring
Tech ·Last spring was a difficult time for me. I lost my grandpa, and my family in Shanghai was in lockdown for several months with limited access to medicine and food supplies. This year’s spring, however, started out much more lighthearted, despite the looming possibility of a company layoff that kept me at a coffee shop on weekends, studying system design interviews. As the month progressed and I awaited the dreaded news, an idea for a little flower map of Seattle came to me.
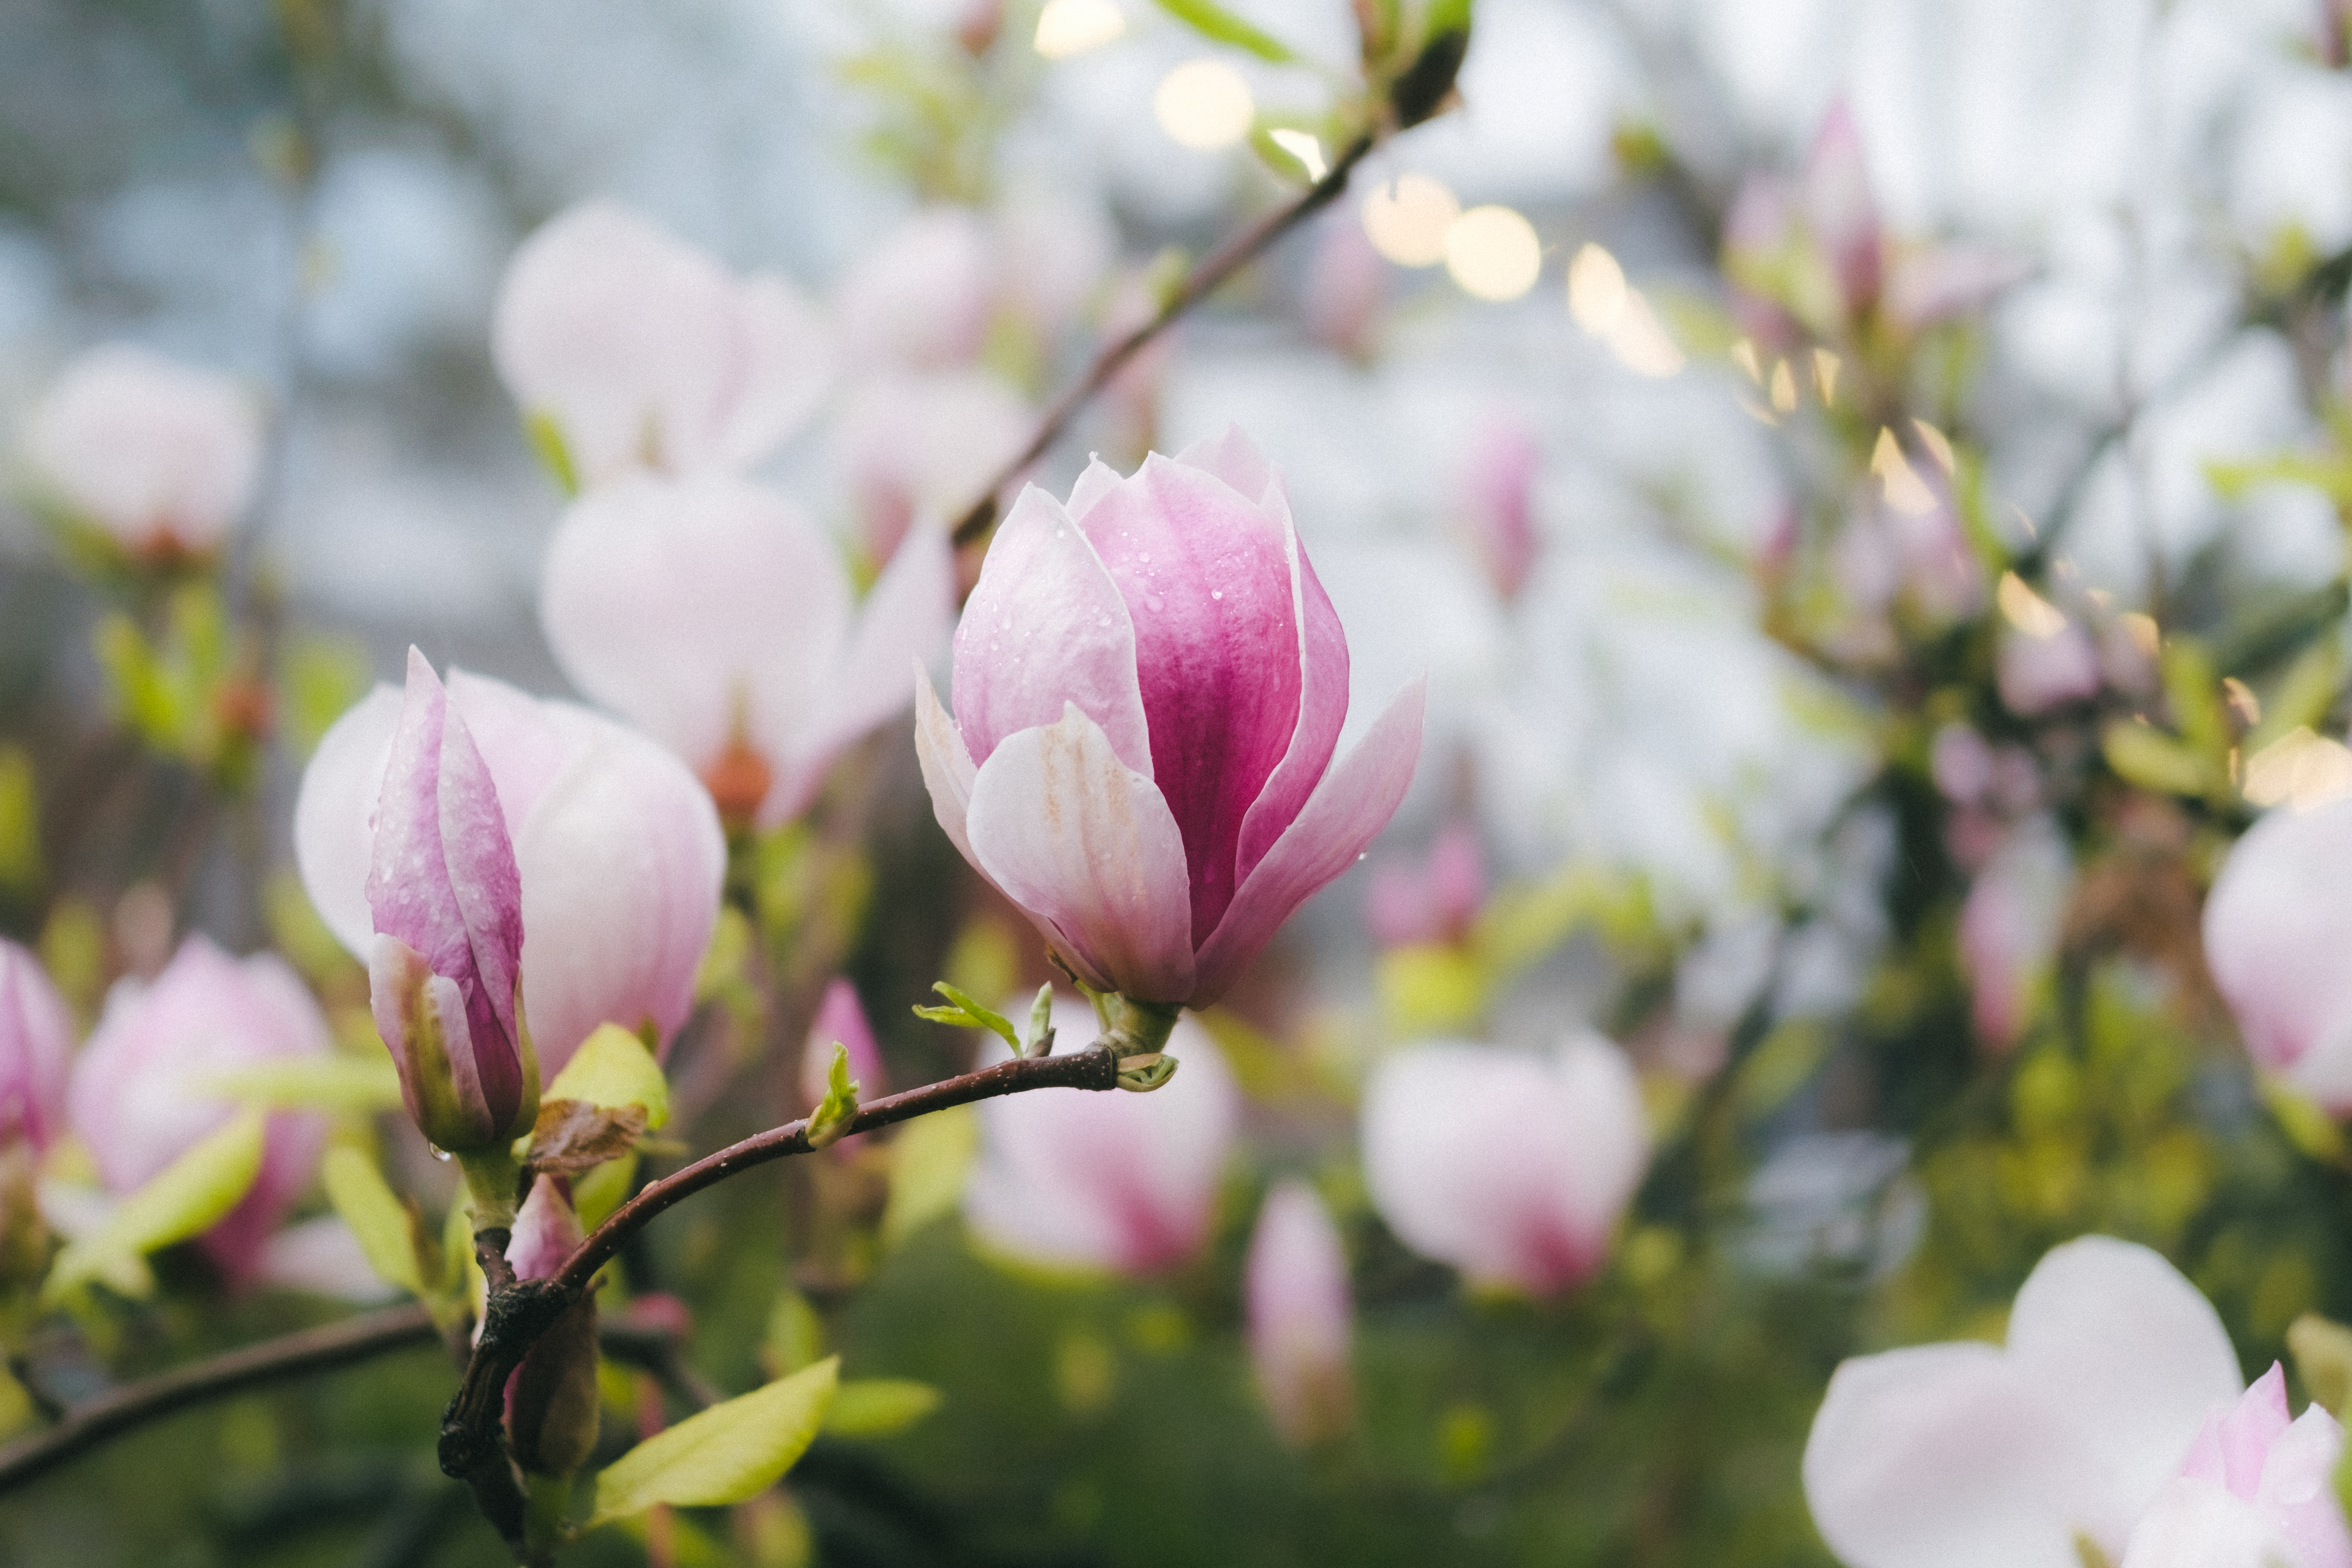
In the past few months, I’ve been picking up my camera more and more, and with spring in full bloom, flowers have been my favorite subject to shoot. They bring me joy. When the layoff news finally came, my emotions were all over the place. To calm down, I decided to take a day off and venture into nature with my camera. I visited Seward Park, my favorite park in the city, and captured the early blooming cherry blossoms. I also explored the UW neighborhood and encountered magnificent cherry blossoms and star magnolias. Walking around the city’s less populated areas and being surprised by the beauty of nature really grounded me.

As a result, I became more curious about flower plants and wanted to learn more about them, starting with their names. I also wanted to follow a flower map and explore less populated areas of the city where I could have unexpected encounters. After a brief search on Google, I couldn’t find anything that met my needs. The idea of making a flower map myself emerged, and I’ve always wanted to do small side projects but lacked good ideas.
The initial idea. Initially, I wasn’t aware of any existing flower data, and I contemplated creating a crowdsourcing platform where people could report flower sightings and mark them on a map. However, the obvious downside of this approach is that I wouldn’t have enough data to show until the platform became popular enough, which is nearly impossible to achieve.
More research. I began researching similar projects and stumbled upon Explore Trees in Singapore which was very similar to my idea. The project was backed by open data sourced from the Singapore government. This discovery led me to wonder whether Seattle also had a similar open dataset, and I found exactly what I needed on the Seattle Open Data. As a result, the project quickly pivoted to creating a visual representation of this dataset.
Process data. Although the dataset contained information on all the street trees in Seattle, my interest was limited to flowers. To achieve this, I adopted an approach of filtering out the top 50 popular flowers in Seattle (with the help of ChatGPT). However, the process was more manual than ideal, as I wanted to vet every type of flower, which proved to be unnecessary in hindsight.
Design. For the design of the project, I wanted to achieve a cute and refreshing look. I utilized Mapbox Studio to style the background, and drew most of the flower icons using Procreate. Despite my limited drawing skills, I was proud to put them to use.

Map framework. After identifying the dataset and designing the visual style of the project, the next challenge was to figure out how to render the data onto a map. Seeking advice from ChatGPT, I discovered that Google Maps, Mapbox, and OpenStreetMap were the most popular options for map rendering. Ultimately, I opted for Mapbox due to its extensive range of customization options and proven APIs. I appreciated that Mapbox only charges when traffic surpasses a certain threshold, which I didn’t expect my website to ever reach. The majority of my time was dedicated to learning how to create datasets using Mapbox and effectively rendering them using React.
I learned how to upload GeoJson to create a tileset and how to style it to render icons. I created 13 layers of data for 13 types of flowers, but encountered a problem: if I tried to render all the layers together, the website would crash on my mobile phone. This was a significant issue, as I wanted to be able to use the map on the go, making mobile optimization essential.
I attempted to combine all the layers into a single layer and render the icons using a case clause, but this approach resulted in even worse performance. I also experimented with preprocessing the data so that icons could be selected directly from an attribute, but the lag persisted.
Clustering. Clustering came to mind as a possible solution, but I had difficulty implementing it with the Mapbox APIs. It turns out that to use clustering with vector sources, I could only use the legacy service, Tippecanoe. I created 13 layers of clustered datasets using Tippecanoe, but unfortunately, the website was still crashing on mobile despite the significantly smaller dataset size.
In the end, I had to make a compromise and decided to only render one type of flower at a time on the map. While this wasn’t ideal, it allowed the website to run smoothly on mobile devices. I’m still hoping to find a way to render all types of flowers together in the future, but for now, I’m happy with it.
Future ideas. I consider this the first usable version of my site, but there are still many things I would like to add to enhance its functionality and usefulness. Some of my main goals for future development include:
- Enabling the rendering of all types of flowers together on the map, with the ability for users to select multiple types at once.
- Implementing a feature to display information about individual flower trees when clicking on them. The dataset contains interesting details such as planting date, diameter, and specific species names.
- Expanding the coverage of the map beyond Seattle to include other areas like Bellevue, which also have similar datasets available.
- And many others
Here it is, my little gift to spring! I sincerely hope that it will bring joy to at least one user - myself. :)